SUPPLY
Inventory
Actual crudes and petroleum products closing inventory for the month of December 2013 was reported at 11,589 thousand barrels (MB) or 38-days supply equivalent; 31 days for crude oil and products in country stocks and 7 days in-transit. This was lower by 11.4 percent from December 2012 level of 13,085 MB. YTD December 2013 average inventory was recorded at 44 days, 36 days in country stock and 8 days in-transit.
Meanwhile, in response to the emergency situation brought about by the recent super typhoon Yolanda, the Department of Energy (DOE) issued a Memorandum which directed the oil companies to engage in Mutual Product Sharing Accommodations (MPSA) in order to provide and stabilize oil supply in the Visayas Region which was badly hit by typhoon Yolanda. To ensure continuous supply of oil, the oil companies were also required to submit weekly the status of stocks of each oil depot in the region including replenishment schedule, as well as the daily movements of oil products from the depots to retail outlets.
In the last quarter of 2013, there was also an alleged LPG supply shortage, specifically in North and South Luzon, respectively. This was perceived because of the long queue of customers at the Liquigaz’s Bataan import terminal/storage.
The alleged tightness in November’s supply of LPG was mainly due to the reported impending increase in LPG Contract Price (CP) for the month of December. However, perceived tightness in supply continued until December.
This was due to the extended shutdown of the refinery in South Luzon which was supposed to be shutdown only for a short period of time. The situation was further aggravated with the non-operation of the Shell Gas Eastern, Inc. (SGEI) Terminal in Batangas (for decommissioning), thus resulting in congestion in North Luzon (Bataan).
Further, oil supply in other areas such as Zamboanga (armed-conflict) and Bohol (earthquake) were also monitored by the DOE to ensure continuous supply.
Crude Oil Supply
Total crude volume imported for the year fell by 11.6 percent from 63,717 MB of 2012 to 56,343 MB. The drop was attributed to the emergency and scheduled maintenance/turnaround of the refiners’ process units sometime in the year which resulted to increased imports of finished petroleum products.
About seventy-six percent of the total crude mix (42,727 MB) originated from the Middle East, of which 41.7 percent (23,500 MB) was sourced from Saudi Arabia, the country’s major supplier of crude oil. On the other hand, 11,673 MB of crude oil was imported from Russia and Korea, equivalent to 20.7 percent of the total crude mix. The remaining 3.4 percent (1,943 MB) was sourced from Brunei, Malaysia, Indonesia and from local production (Fig. 1).

Petroleum Product Imports
Petroleum product imports as of end year 2013 reached 62,112 MB, an increase of 13.4 percent from 2012’s 54,780 MB. This may be due to the large imports of the oil refiners to augment their supply because of the reduced production volume due to emergency/maintenance shut down.
All petroleum products imported for the period increased vis-à-vis 2012 level. Diesel oil import was up by 5.3 percent. Unleaded gasoline import also rose by 17.4 percent while kerosene/avturbo grew by 28.7 percent. LPG import was higher by 9.1 percent while fuel oil import up surged by 89.1 percent.
The new industry players accounted for majority of the product imports with 55.8 percent of the total imports volume, up by 17.0 percent to 34,674 MB from 2012’s 29,628 MB. The oil majors (Petron, Chevron and Shell) accounted for the remaining 44.2 percent which increased by 9.1 percent from 2012’s 25,151 MB to 27,438 MB.
The local refiners (Petron and Pilipinas Shell) accounted for 28.5 percent of the total product imports, which included blending stocks, as against 71.5 percent share by direct importers.
Product import mix comprised mostly of diesel oil at 42.3 percent, unleaded gasoline at 23.4 percent, LPG at 14.4 percent, kerosene/ avturbo at 12.7 percent, fuel oil at 4.3 percent and other products at 2.9 percent share in the total product mix.
Total gasoline import reached 52.9 percent of gasoline demand while diesel oil import was 53.1 percent of diesel demand. LPG import on the other hand, was 70.4 percent of LPG demand. Total product import was 52.9 percent of the total products demand.
The oil majors’ import share in the total demand was 23.4 percent while the other players’ import share was at 29.5 percent. As for the refiners, their import share in the total demand was 15.0 percent, while 29.5 percent was attributed to direct importers.
Crude Run and Refinery Production
The country’s current maximum working crude distillation capacity is 284 thousand barrels per stream day (MBSD). /p>
Total crude processed as of full year 2013 dropped by 7.5 percent from 62,391 MB of full year 2012 to 57,711 MB.. The reported refinery capacity utilization also declined from 62.0 percent in 2012 to 55.6 percent this year. This was due to the extended emergency/maintenance shutdown of the refineries in the country sometime in the year as cited previously. /p>
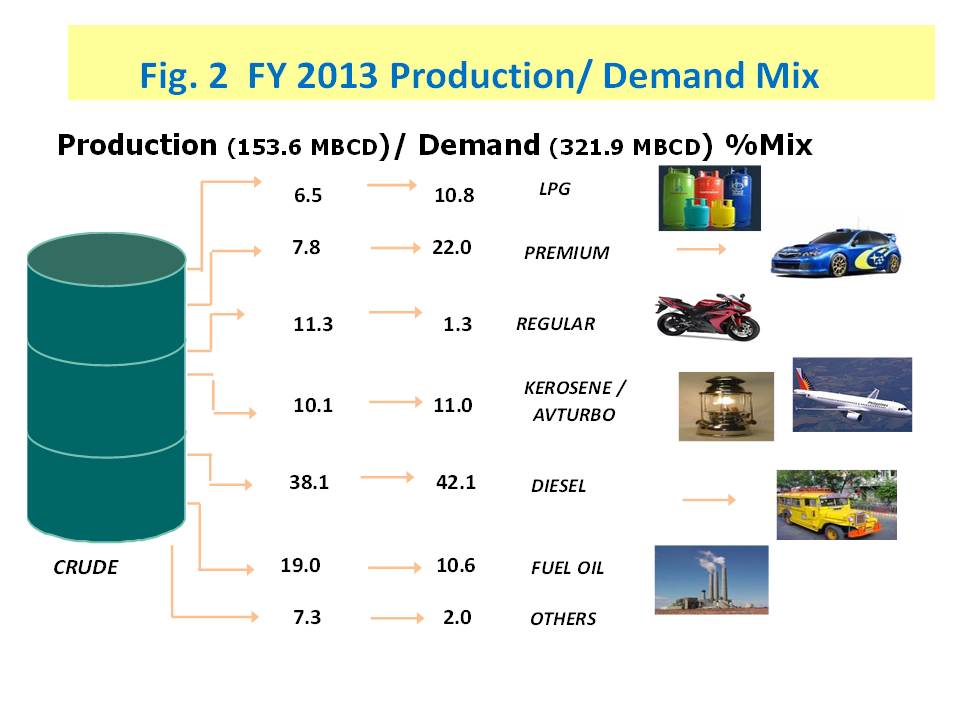
Consequently, local petroleum refinery production output also went down by 7.0 percent from 60,293 MB to 56,047 MB. Full year 2013 average refining output was at 153.6 MB per day./p>
Volume wise, refinery output of diesel oil fell by 5.7 percent vis-à-vis 2012 level. Unleaded gasoline and fuel oil also dropped by 11.1 and 7.4 percent, respectively. As for kerosene/avturbo and LPG, these products decreased by 10.5 and 7.0 percent, respectively./p>
Diesel oil continued to dominate the production mix with a share of 38.1 percent, followed by fuel oil and unleaded gasoline which both got 19.4 percent share. Next was kerosene/avturbo and LPG with shares of 10.1 and 6.5 percent, respectively (Fig. 2).
DEMAND
Petroleum Product Demand
FY 2013 total demand of finished petroleum products grew by 5.9 percent to 117,489 MB from 100,991 MB of full year 2012. This can be translated to an average daily requirement of 321.9 MB compared with last year’s level of 303.3 MB.
Compared with 2012 figures, diesel oil demand posted an increase of 6.3 percent while unleaded gasoline demand rose by 6.1 percent. Kerosene/avturbo and LPG also grew by 5.0 and 2.3 percent, respectively. On the other hand, fuel oil demand slightly dropped by 0.4 percent. Product demand mix comprised mostly of diesel oil at 42.1 percent, unleaded gasoline at 23.4 percent, kerosene/ avturbo at 11.0 percent, LPG at 10.8 percent, fuel oil at 10.6 percent and other products at 2.0 percent share in the total product mix (Fig. 2).
Petroleum Product Exports
Total petroleum products exported in 2013 decreased by 8.3 percent from 9,395 MB of year 2012 to 8,619 MB.
Condensate exports, the top exported product for the period, fell by 16.7 percent vis-à-vis 2012. Mixed xylene, reformate and toluene also decreased by 49.7, 31.6 and 22.4 percent, respectively. Naphtha and fuel oil, on the other hand, rose by 41.8 and 17.8 percent, respectively.
The total export mix comprised of condensate (44.3 percent); naphtha (26.2 percent); fuel oil (18.3 percent); mixed xylene (5.2 percent); toluene (3.0 percent); toluene (1.3 percent); benzene (1.8 percent); and reformate (1.0 percent), respectively.
The oil refiners’ exports accounted for 55.7 percent of the total export mix while the remaining 44.3 percent was accounted to exports of Shell Philippines Exploration B. V. (SPEX) and LPG exports of Liquigaz.
Crude Oil Exports
A total of 1,388 MB crude oil from Galoc (Palawan Light) was exported during the period, slightly lower by 0.9 percent from 2012’s 1,401 MB.
MARKET SHARE
Total Petroleum Products
The major oil companies (Petron Corp., Chevron Phils. and Pilipinas Shell Petroleum Corp.) got 69.1 percent market share of the total demand while the other industry players which include PTT Philippine Corp. (PTTPC), Total Phils., Seaoil Corp., TWA, Filpride, Phoenix, Liquigaz, Petronas, Prycegas, Micro Dragon, Unioil, Isla LPG Corp., Jetti, Eastern Corp., Perdido, Ixion, Jaris and Filoil Gas Co., as well as the end users who imported directly part of their requirement captured 30.9 percent of the market (Fig. 3).
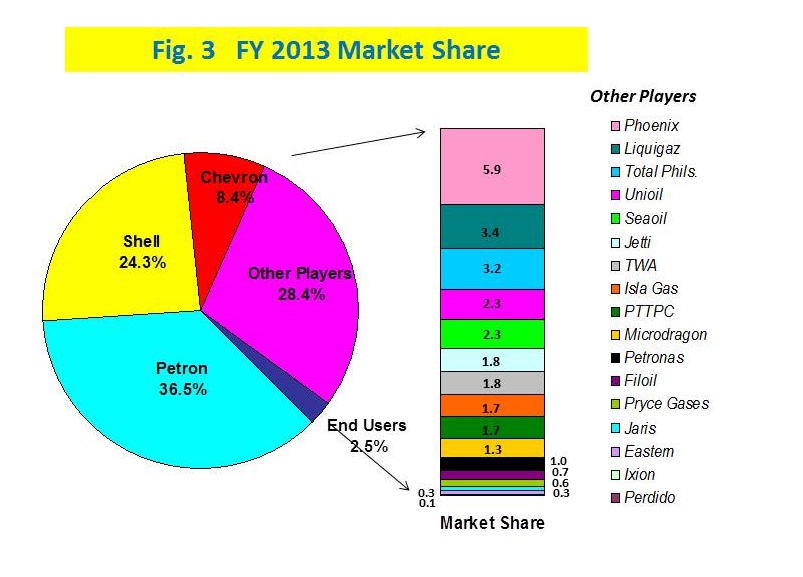
Meanwhile, the local refiners (Petron Corp. and Pilipinas Shell) captured 60.8 percent of the total market demand while 39.2 percent was credited to direct importers/distributors.
LPG
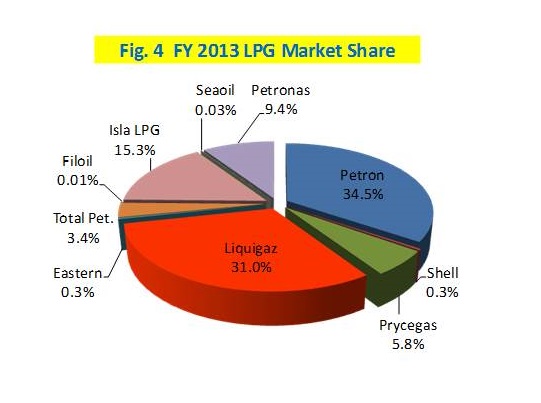
The LPG market share of the oil refiners was reduced to 34.8 percent since Pilipinas Shell sold its interest in the entire issued share capital of Shell Gas (LPG) Philippines Inc. to Isla LPG Corp. in 2012. The other players on the other hand, with the entry of Isla LPG, increased to 65.2 percent.
Among the other LPG players, Liquigaz got the biggest market share with a 31.0 percent share, followed by Isla LPG with a share of 15.3 percent. Next was Petronas with a share of 9.4 percent (Fig. 4).
OIL IMPORT BILL
FY 2013 estimated total oil import bill amounting to $13,174.9 million was down by 5.0 percent from 2012’s $13,862.0 million due to the decrease in crude import volume. Also, import costs of both crude and petroleum products in 2012 were cheaper vis-a-vis this year.
Total oil import cost was made up of 47.5 percent crude oil and 52.5 percent finished products.
Import cost of crude oil, amounting to $6,256.7 million at an average CIF cost of $111.046/bbl, was 13.9 percent lower than $7,271.0 million of 2012’s level at an average CIF cost of $114.114/bbl.
Meanwhile, total product import cost increased by 5.0 percent to $6,918.2 million at an average CIF cost of $111.483/bbl vis-à-vis 2012’s $6,591.0 million at an average CIF cost of $120.318/bbl.
On the other hand, the country’s petroleum exports earnings for the period dropped by 12.8 percent from $1,233.9 million to $1,076.3 million in 2013.
Overall, the country’s 2013 net oil import bill amounting to $12,098.6 million was down by 4.2 percent from 2012’s $12,628.1 million.