OIL SUPPLY/DEMAND REPORT 2008
SUPPLY
Inventory
In the local market, actual inventory as of end December 2008 was recorded at 14MMB or 48-days supply equivalent (46 days for crude oil and products in stock and 2 days for crude in-transit to the country). This is 12.3 percent lower than last year’s end-December level equivalent to 16.1 MMB. Meanwhile, 2008 average inventory was reported at 50 days, 39 days in stock and 11 days in-transit.
With regard to LPG supply, there appeared some sort of shortage particularly in the Luzon areas because of long queues of tank trucks at the LPG import terminals/bulk plants by the last week of December. There were reports of queues of trucks with empty LPG cylinders at the refilling plants, as well as lack of LPG in cylinders at the dealer and retail levels, and in taxi garage/terminals and even auto-LPG stations.
DOE’s monitoring of inventory and imports, both from oil company reports and actual inspections, showed sufficient supply of LPG in the country and that the problem was mainly of the distribution/logistics in nature.
Crude Oil Imports
Full year 2008 total crude imports of 69.5 MMB was a 6.6 percent drop from the 2007 level of 74.4 MMB. Petron’s maintenance shutdown in December of its refinery contributed to the decreased volume.
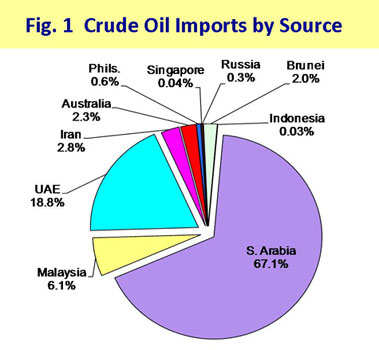
Total Middle East crudes (61.6 MMB) represented 88.6% of the total crude mix while crude from the Far East region (6.1 MMB) such as Malaysia, Brunei, Philippines and Singapore supplied 8.8% of the total crude mix. On the other hand, a total of 1.6 MMB crude was imported from Australia, equivalent to 2.3% of the total crude mix. The remaining 0.3% was sourced from Russia (180 MB) (Fig. 1).
Saudi Arabia maintained its position as the top exporter of crude into the country, supplying more than sixty percent (67.0%) of the total crude requirement. Next was UAE with an 18.8% share, followed by Malaysia with a 6.1% share (Fig. 1).
Petroleum Product Imports
Import volume of finished petroleum products for 2008 was up by 5.7 percent from 45.7 MMB of a year ago level to 48.3 MMB.
Compared with last year’s level, fuel oil posted the highest increase of 49.4 percent. Diesel oil also rose by 9.6 percent. However, imports of LPG and unleaded gasoline dropped by 9.3 and 5.7 percentages, respectively.
The oil majors (Petron, Chevron and Shell) accounted for 62.8 percent of the total import volume with an increase of 9.0 percent from last year’s level of 27.8 MMB to 30.3 MMB. The growth may be due to Petron’s increased volume of product imports due to the total shutdown of its refinery for maintenance sometime during the last quarter of 2008. As for other industry players’ import volume which accounted for the remaining 37.2 percent, a slight increase of 0.4 percent was recorded from last year’s 17.9 MMB to 18.0 MMB this year.
Meanwhile, the direct importers accounted for 66.7 percent (32.2 MMB) of the total product imports while the remaining 33.3 percent (16.1 MMB) was attributed to the local refiners (Petron and Shell).
Product import mix were comprised mostly of diesel oil at 37.0 percent, unleaded gasoline at 22.3 percent, LPG at 16.7 percent, fuel oil at 14.7 percent, kerosene/avturbo at 7.8 percent and other products at 1.4 percent.
Total gasoline import reached 48.9 percent of gasoline demand while diesel oil import was 44.0 percent of diesel demand. LPG import on the other hand, was 70.1 percent of LPG demand. Total product import was 47.7 percent of the total products demand.
Meanwhile, the oil majors’ import share in the total demand was 30.0 percent while the other players’ import share was at 17.8 percent. As for the refiners, their import share in the total demand was at 15.9 percent, while 31.8 percent was attributed to direct importers.
With the implementation of the Biofuels Law, some players have started to blend fuel bioethanol in their gasoline. A total of 78.9 MB ethanol was imported during the period. By February 2009, at least 5% fuel bioethanol shall comprise the annual total volume of gasoline actually sold and distributed by all oil companies in the country. The bioethanol blend should conform to the Philippine National Standards (PNS).
Crude Run and Refinery Production
The country’s maximum working crude distillation capacity was 284 thousand barrels per stream day (MBSD).
Meanwhile, due to emergency and maintenance shutdowns of the local refiners sometime during the year, total crude processed locally dropped by 10.5% from 75.1 MMB of 2007 to 67.2 MMB. Further, the local refinery capacity utilization during the period was also down by 12.3 percent from 73.7% of same level last year to 64.6%.
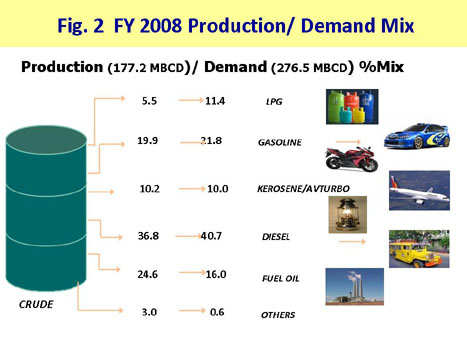
Local petroleum refinery production output also declined by 10.1 percent from last year’s 72.1 MMB to 64.9 MMB. 2008 average refining output was at 177.2 MB per day.
Diesel oil and fuel oil continued to dominate the production mix with shares of 36.8 and 24.6 percent, respectively. This was followed by unleaded gasoline at 19.9 percent, kerosene/avturbo at 10.2 percent, LPG at 5.5 percent and other products at 3.0 percent (Fig. 2).
Production output of LPG and unleaded gasoline posted increases of 20.5 and 3.4 percent, respectively vis-à-vis 2007 level while fuel oil and diesel oil refinery output on the other hand, dropped by 24.7 and 9.8 percent, respectively.
DEMAND
Petroleum Product Demand
The country’s total demand of petroleum products for 2008 declined by 3.4 percent from 104.8 MMB of last year’s level to 101.2 MMB. This can be translated to an average daily requirement of 276.5 MB.
Compared with 2007’s demand, fuel oil posted the largest decrease of 11.3 percent, followed by unleaded gasoline with a 5.0 percent drop. Demand for kerosene/avturbo and LPG also fell by 3.0 and 1.1 percentages, respectively. However, demand for diesel slightly grew by 0.4 percent.
Diesel oil obtained the largest share of 40.2 percent in the total sales mix, trailed by unleaded gasoline, fuel oil, LPG and kerosene/avturbo at 21.8, 16.0, 11.4 and 10.0 percentages, respectively (Fig. 3).
With more taxis shifting to LPG as fuel, demand for automotive LPG was 10.9 percent of the total LPG demand vis-a-vis 2007’s 6.6 percent.
Petroleum Product Exports
Total petroleum products exported for the period decreased by 4.5 percent from 18.7 MMB of 2007 to 17.8 MMB. Fuel oil and kerosene/avturbo exports fell by 22.1 and 71.5 percent, respectively vis-a-vis last year’s level. On the other hand, diesel oil exports recorded a 33.8 percent increase. Meanwhile, a total of 303 MB and 103 MB unleaded gasoline and LPG was exported for the period which was zero at last year’s level.
On a per product basis, total export mix comprised of fuel oil (42.6 percent), condensate (31.2 percent); diesel oil (4.0 percent); unleaded gasoline (1.7 percent); LPG (0.6 percent); kerosene/avturbo (0.4 percent) and other products (19.5 percent), respectively.
The oil majors accounted for 68.7 percent of the total exports, while the condensate and LPG exports of Shell Philippines Exploration B. V. (SPEX) and Liquigaz accounted for the remaining 31.3 percent.
On the other hand, a total of 504 MB Palawan Light crude was exported to Thailand and South Korea during the period.
MARKET SHARE
Total Petroleum Products
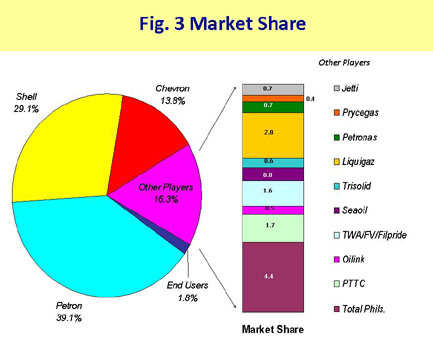
Petron Corp., Chevron Phils. and Pilipinas Shell Petroleum Corp. maintained their dominance of the market with a total of 81.9 percent share of total demand.
On the other hand, the other industry players which include PTT Philippine Corp. (PTTPC), Total Phils., Oilink, Seaoil Corp., TWA/Filpride, Liquigaz, Petronas, Prycegas, Trisolid, Andan, Mawab and Jetti as well as the end users who directly imported part of their requirement got 18.1 percent of the market (Fig. 3).
Meanwhile, the local refiners (Petron Corp. and Pilipinas Shell) captured 68.2 percent of the total market demand, while 31.8 percent was credited to direct importers/distributors.
LPG
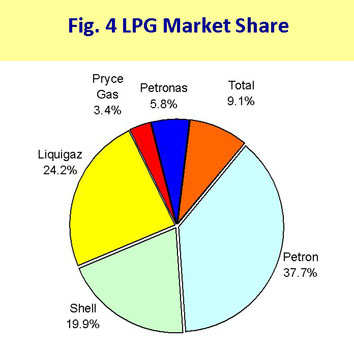
In the LPG industry, Petron Corp. and Pilipinas Shell Petroleum Corporation’s market shares totaled 57.6 percent while the other players obtained 42.4 percent. Among the other LPG players, Liquigaz got the biggest market share with a 24.2 percent share, followed by Total Petroleum with a share of 9.1percent.
Total LPG market share of the other players grew from 2007’s 39.2 percent to 42.4 percent (Fig. 4).
OIL IMPORT BILL
According to US-Energy Information Administration (EIA) office, the oil price path going forward will be driven mainly by the depth and duration of the global economic downturn, the pace and timing of the recovery, and actual OPEC production.
In the local market, 2008 total oil import bill amounting to $12.0 billion surged by thirty-five percent compared with 2007 level of $8.9 billion. This was because of the high import cost of both crudes and petroleum products during the period as compared to year ago level.
Total oil import cost was made up of 59.7 percent crude oil and 40.3 percent finished products. Import cost of crude oil amounted to $7.2 billion at an average CIF cost of $103.314/bbl, up by 33.3 percent from the 2007 level of $5.4 billion at an average CIF cost of $72.408/bbl.
Meanwhile, 2008 total product import cost also increased by 37.6 percent to $4.8 billion at an average CIF cost of $100.343/bbl vis-à-vis last year’s $3.5 billion at an average CIF cost of $77.067/bbl.
The country’s petroleum export earnings rose by 29.8% to $1.7 billion from last year’s $1.3 million.
Overall, the country’s net oil import bill for the period amounting to $10.3 billion was higher by 35.9 percent from last year’s $7.6 billion.


